
A retail organization operating across multiple regions lacked centralized visibility into revenue, profitability, and product performance. Reporting was fragmented, and leadership relied on delayed, manually compiled Excel reports.
DataPond implemented a comprehensive Revenue & Profitability Intelligence Dashboard using Power BI to provide real-time, multi-level business insights — from executive KPIs down to transaction-level detail.
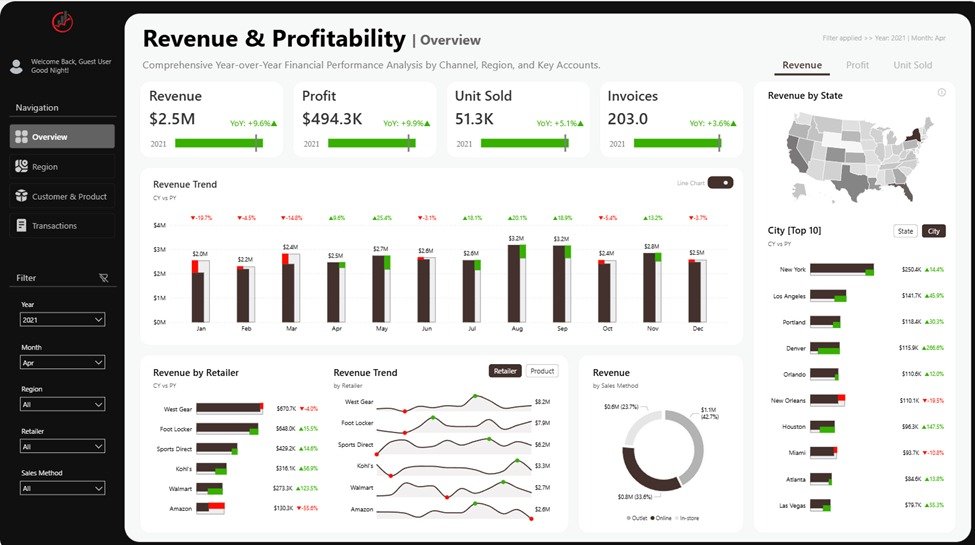
Provide leadership with a consolidated, real-time financial performance view.
This page enables executives to quickly assess overall business health, track growth trends, and identify geographic revenue drivers. It eliminates manual report consolidation and provides a single source of truth for financial decision-making.
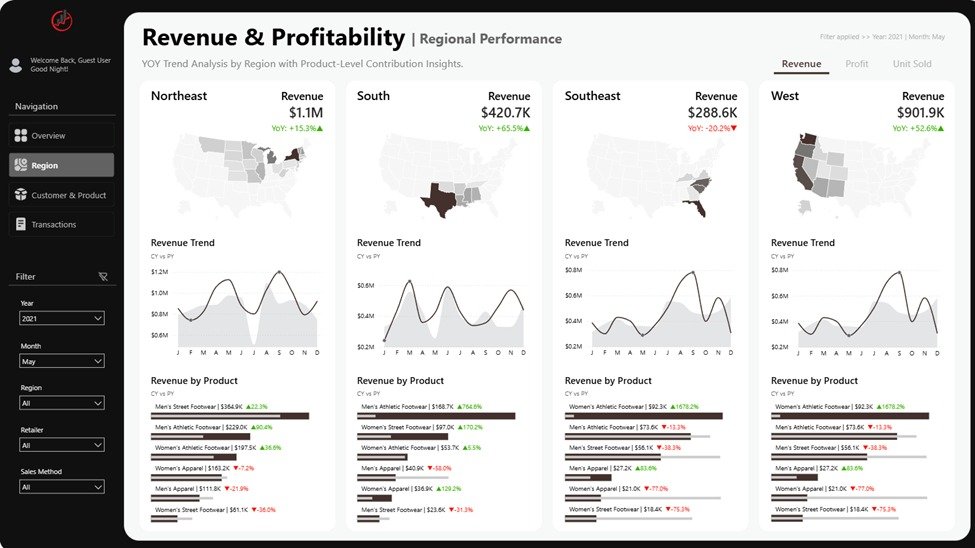
Enable regional performance comparison and product contribution analysis.
Regional managers can now track performance independently while executives maintain centralized oversight.
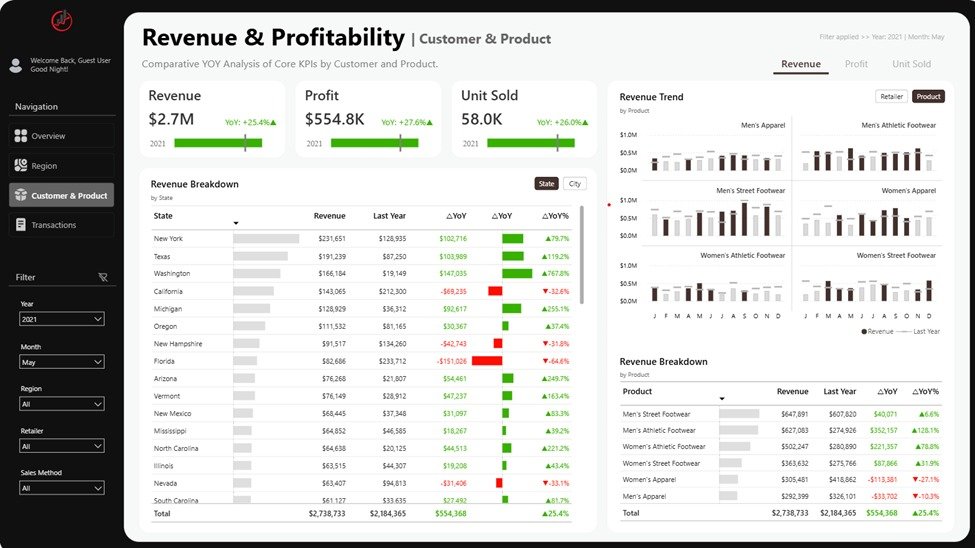
Analyze revenue and profitability at customer and product levels.
This layer transforms raw sales data into actionable commercial strategy insights.
Provide detailed drill-down access for finance and operations teams.
Executives can seamlessly move from high-level summary to transaction-level analysis within the same ecosystem.
The organization transitioned from static, reactive reporting to a dynamic performance intelligence platform. Leadership now operates with real-time revenue clarity, regional visibility, and product-level profitability insights — enabling faster, data-driven strategic decisions.
Industry: Hospital & Multi-Specialty Healthcare Network
Solution: Microsoft Power BI
A multi-specialty hospital network required a unified analytics platform to monitor patient demographics, clinical trends, operational efficiency, and treatment-related financial performance. Existing reporting relied on siloed systems and manual compilation, resulting in delayed insights and inconsistent KPIs.
DataPond implemented a comprehensive Healthcare Intelligence Dashboard using Microsoft Power BI to provide real-time visibility across patient flow, length of stay, billing performance, and medical condition analysis.
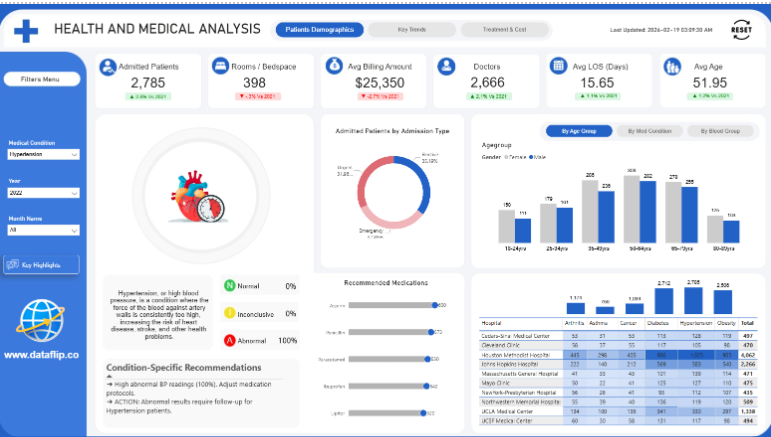
Provide leadership with a high-level operational snapshot of hospital performance.
This dashboard enables administrators to:
Executives gain immediate clarity on operational load and patient distribution patterns.
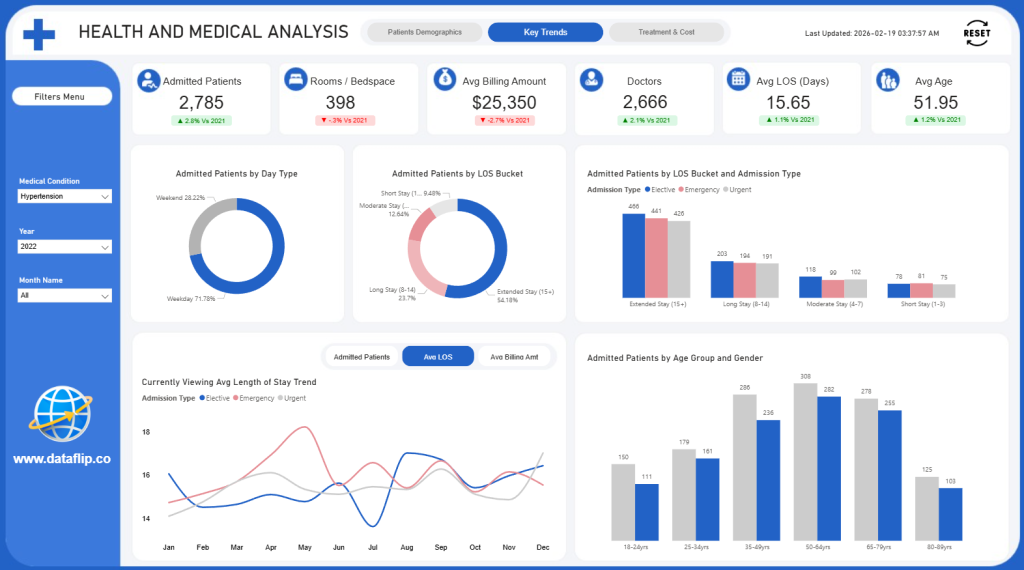
Analyze patient flow trends and hospitalization duration patterns.
This page helps hospital management optimize operational efficiency and reduce unnecessary extended stays.
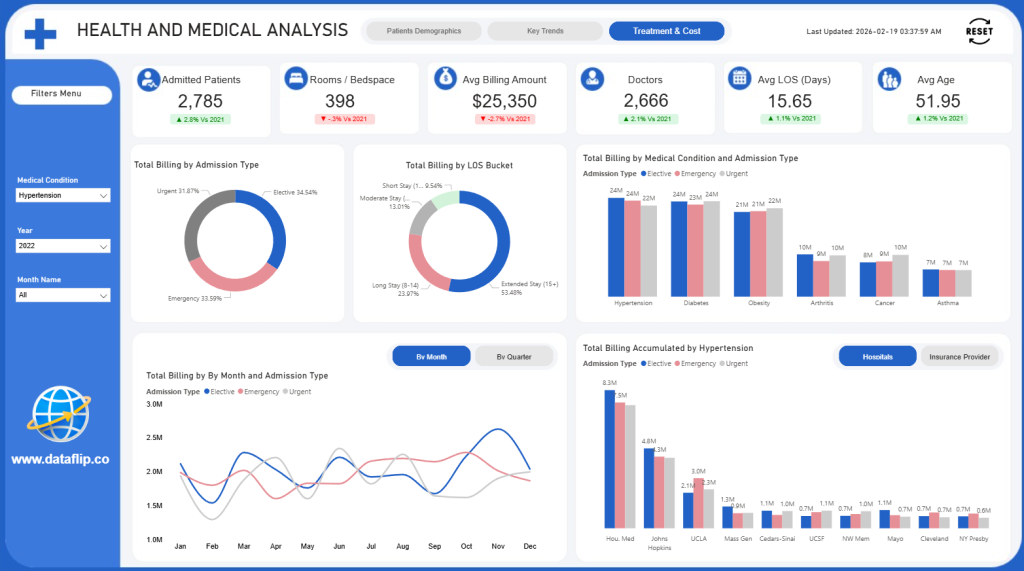
Provide financial transparency across treatment types and medical conditions.
The hospital transitioned from fragmented reporting to an integrated healthcare intelligence platform. Leadership now has real-time visibility into operational performance, patient demographics, and treatment-based financial impact — enabling faster, evidence-based decisions that improve both patient care and financial stability.
WhatsApp us